Data analysis on Health Assurance scheme
By Shri Avinash Jadhav, Deputy Accountant General
Government launched a medical assurance scheme to provide the cashless treatment to BPL families up to ₹ 2.00 lakh per annum on a floater basis. Eventually, the scheme was extended to all non-BPL poor families with an annual income up to ₹ 1.20 lakh. The scheme provides for treatment of 544 predefined surgical/non-medicated procedures for 11 clusters1 of diseases in the empanelled government/private hospitals.
Why this topic was selected?
Availability of complete, structured and reliable data is the prerequisite for Big Data Analysis. This is the fully online scheme where, from the enrolment of beneficiaries to the hospital claim processing is being done digitally. Private IT Support Agency is responsible for the development of software and enrolment of beneficiaries. This is an end-to-end web based portal in which the software at the back end is SQL 2012 R2 Server Edition and at front end is ASP.net. The database size is around 470 GB. So, the complete data of the scheme is available in structured form. But it was important to assess the reliability of available data.
IS audit should be the precursor of Big Data Analysis to validate the reliability of data. Due to the paucity of time, IS audit of the scheme could not be undertaken, but a brief inspection of the IT systems for its robustness was carried out and the authenticity of data was assured.
Objective of Data Analysis
Data analysis is meant to throw the light on the vulnerabilities and to help us to detect the risk areas. In our case, risk analysis has been done on the basis of data analytics to identify the risk areas in the activities of the audit entity and to select the audit samples in such a manner that audit addresses maximum inherent and control risks. Entity is having mainly two sets of data (i) Enrolment data and (ii) Hospital Transaction data. SQL dump data of the above was obtained from the entity and analyzed using Tableau/IDEA at Centre for Data Management and Analytics (CDMA) to get insights about the focus areas for field audit.
Analysis and the results
Enrolment of beneficiaries across the districts for the scheme was analysed by correlating the enrolment data with Census data and BPL population data to see if the coverage is commensurate with the respective populations. (Image1and2). Moreover, data of family members was analysed for the relationship with Head of Family, date of birth, their dependency and limitation of five members as per Ration Card.
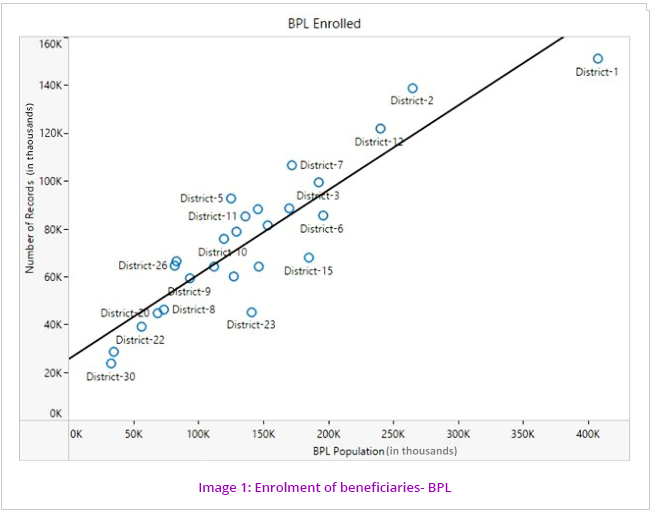
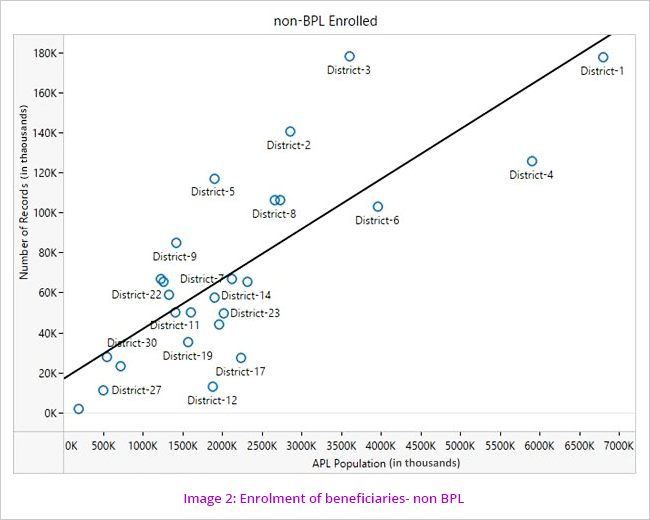
The pattern of coverage shows more correlation in the BPL than the non BPL. Probable reasons for this are either non-mobilization of machinery to bring the BPL families to the enrolment kiosks or the number of kiosks is not sufficient to cater to the needs of the population. Poor check/controls over the enrolment of non BPL beneficiaries can also be the reason for comparatively more coverage.
Analysis of the Claims
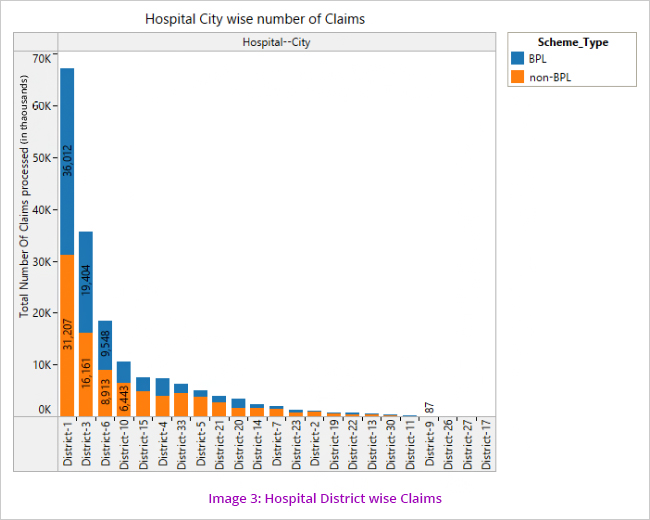
Number of beneficiaries of the scheme was analysed. It could be observed that most claims are being processed in District 1 (Image 3)
However on an analysis of patient districts wise claims, it is seen that the highest number of claims come from patients belonging to District 3.
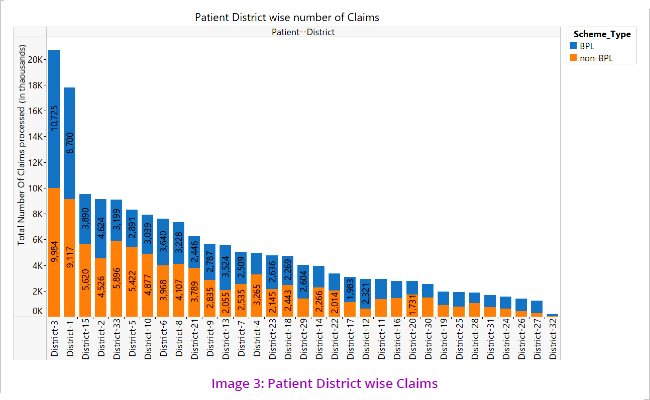
The above visualisations (Image 3 and 4) led to the understanding that patients move from one district to another for treatment which led us to further analyse the pattern/cases of movement of patients from one district to other. (Image 5)
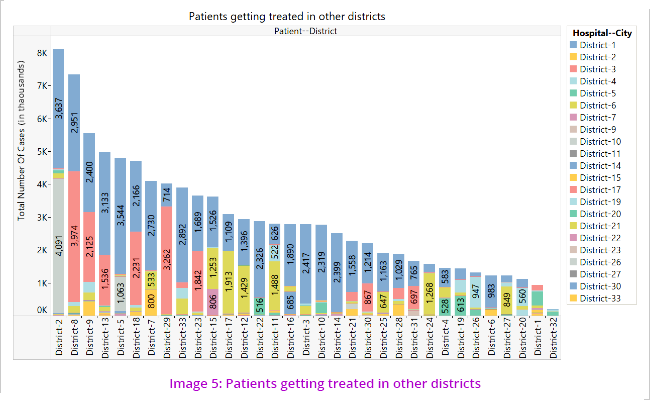
The segmentations revealed that most number of beneficiaries who took treatment outside their own districts are from Districts 2, 8 and 9. The primary disease clusters for which the patients go to other districts are oncology, genitourinary and cardiology. (Image 6)
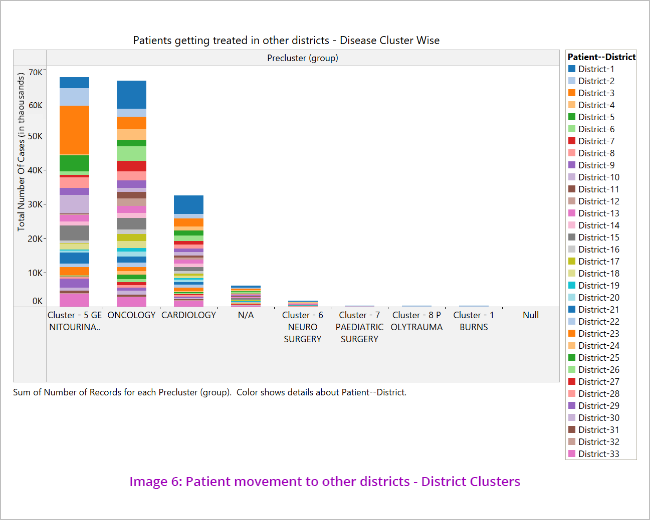
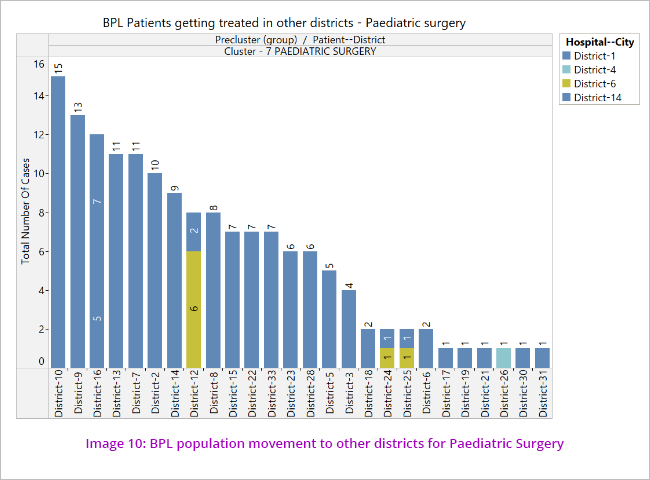
The data was further analysed to see the disease cluster wise pattern of movement of patients to other districts for treatment. (Image 7)
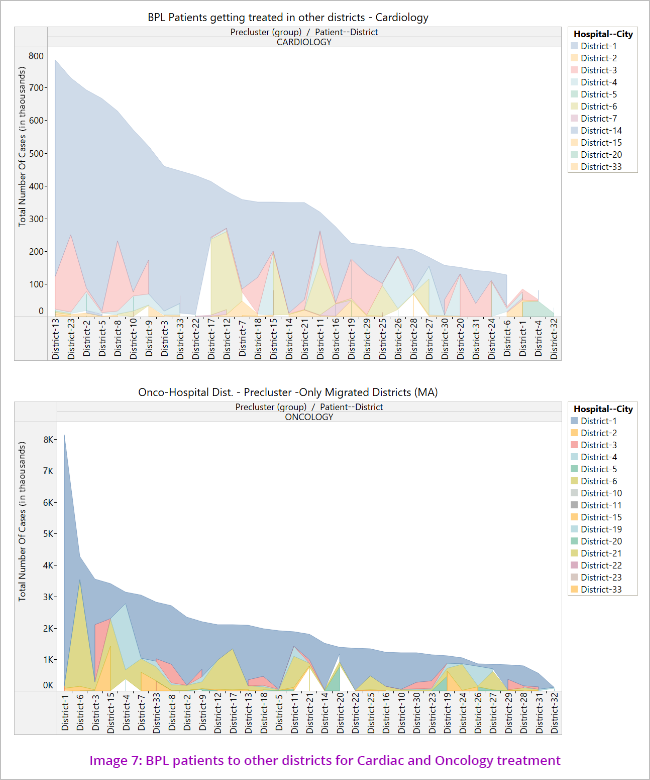
This indicates non availability of uniform health facilities across the State where beneficiaries not getting treatment facilities in their own cities and forced to move out.
Disease/Disorder distribution
The data showed that most of the beneficiaries’ claims are for Genito-urinary diseases, followed by Oncology and Cardiology. (Image 8) Further analysis also indicated that number of claims in Genitourinary cluster (dialysis/renal) was the highest while the claim amount was maximum in the cardiology cluster.
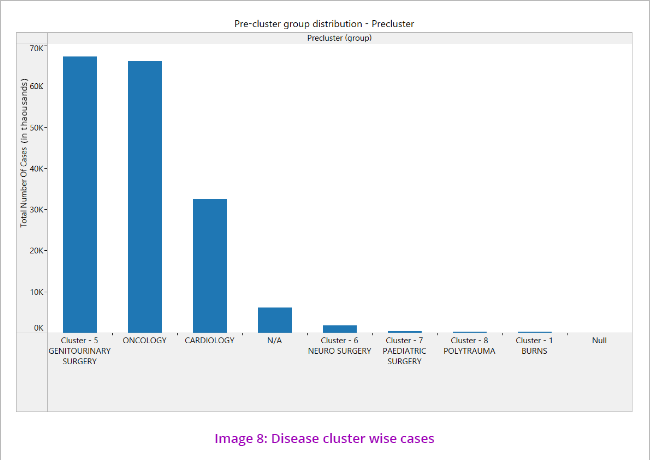
It is also noticed that around 6000 records do not have any disease cluster group mentioned, which is a discrepancy. This will be one of the risk areas for our audit.
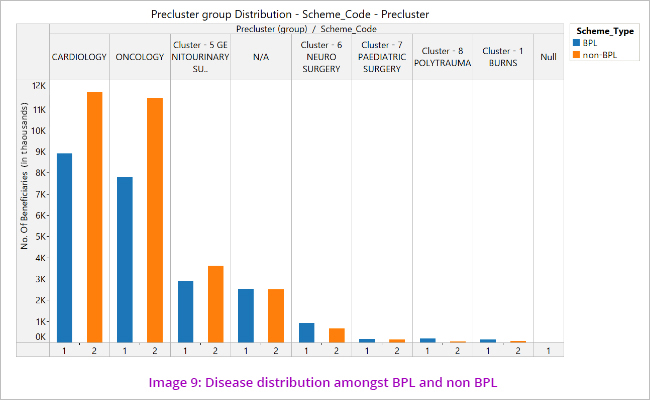
The disease clusters spread amongst the scheme types show that Cardiology claims are more amongst BPL whereas Oncology claims are more amongst the non BPL category. (Image 9)
Exceptions
Apart from identifying the risks certain exceptions, such as transactions without the doctor’s name, transactions where the claim amount had exceeded two lakh rupees, and other exceptions like this were identified. These exceptions would be verified during substantive audit for correctness.
Deriving Audit Objectives
The insights derived from the visualisations, as shown above led to the identification of risks, from where audit objectives were drawn. The audit objectives could be summed up as:
Whether proper procedures have been followed during the process of enrolment
Whether hospitals have been empanelled against the standard benchmarks
Whether cashless treatment have been provided to the beneficiaries
Whether claims were passed with reference to pre-authorisation approval.
Challenges faced during audit –
Human nature is averse to change. Being the new concept in Government audit, psychological barrier was the biggest challenge while doing the big data analytics. In our case, initially the team members were hesitant and raised doubts about the need and efficacy of such type of analysis. Big data analysis was confused with IS audit. But, through constant persuasion and insistence, the work of data analysis began and as the analysis took momentum and started showing some visible outcomes, its importance was realized and the attitude of our team changed.
Some of our team members were not trained in data analytics. So, we provided them the CDMA training module of Knime and Tableau which gave the basic idea about the data analysis and use of these tools.
Regarding data analysis, we faced three levels of challenge. The first level challenge was to get the access above to dump data (SQL database) from the engaged agencies. After several pursuance, health department obtained the dump database (for the period from 2012-13 to 2016-17) from the agencies and handed over it to audit team in the external hard disk.
Second level challenge was restoration of available data. In our office, the process of procurement of server and desktops was not completed by the time of analysis. Due to non-availability of hardware/software, it was decided to take help of CDMA. The dump data was taken to CDMA and there it was analyzed.
Third level challenge was to verify the documents uploaded at the server for the purpose of enrollment and for hospital treatment/claim process. The audit team got the view rights at par with the view rights of SNC to verify the documents available online.
Lastly, it was very important to absorb the outcomes of data analysis in the audit guidelines. Due care and supervision was required at this stage. The audit objectives, audit questions and sub questions were carefully woven around the results of data analysis.
To conclude, the data analysis of Health Assurance Scheme gave us valuable insights about the functioning of the scheme which would help while doing the audit. In process, we also developed the Data Analytics Model which would further help us to do ‘Follow up’ audit.
1. (1) Burns, (2) Cardiology, (3) Cardiothorasic Surgery, (4) Cardiovascular Surgery, (5) Genitourinary Surgery, (6) Neuro Surgery, (7) Peadiatict Surgeries, (8) Poly Trauma, (9) Medical Oncology, (10) Radiation Oncology and (11) Surgical Oncology.
|