Selecting Sampling Methods
By Ms. Sarah Oberst, Research Associate, Evidence for Policy Design, Harvard Kennedy School
This report considers how targeted sampling methods, paired with available data, could be used to increase the overall effectiveness of performance audit. Performance audit evaluates the efficiency, economy and effectiveness of a given entity or program, in an effort to move beyond financial compliance and "cope with the intricate questions of measuring the performance and results of [India's] huge investments and expenditure1." Here we consider how methods drawn from financial audits could inform sampling mechanisms for performance audits.
In particular, we will focus on the National Rural Employment Guarantee Act (NREGA) Performance Audit (Report no 6 of 2013); however, the principles are applicable to the performance audit process in general. The recommendations contained in this document have arisen from close review of the Supreme Audit Institution (SAI), India and International Organization of Supreme Audit Institutions (INTOSAI) guidelines on performance and financial audits, data analysis through the NREGA Management Information System (MIS) Public Data Portal and 2011 Census of India data, and consultation with colleagues at SAI India and professors at Harvard University.
This analysis finds that a stratified sampling methodology based on rural population or NREGA expenditure could have aided in the identification of underperforming regions under the scheme and enhanced the effectiveness of the performance audit process. This approach would have increased the efficiency of the audit in examining a higher proportion of high-impact areas, such as those with especially high expenditures or large rural populations. This would have given a clearer picture of the implementation of NREGA in areas of high importance while still fulfilling the audit requirements of representativeness and randomization. Ultimately, this approach could have both identified a greater proportion of key failures on the ground in the audit report, and at the same time would have acted as an increased deterrent against future implementation failures in high importance areas.
Sampling in the NREGA Performance Audit
The NREGA performance audit employed a multi-stage random sampling approach for the selection of districts, blocks, gram panchayats (GPs), works and beneficiaries for inclusion in the audit, resulting in the selection of 182 districts, from which 458 blocks and then 3,848 GPs were selected2. While this selection process ensures that each district in India is equally likely to be selected for audit, it neglects the wide variation in NREGA spending and rural population across the country. In FY2011-12, districts in India ranged in rural population from 5,620 persons to 6,074,188 persons3 and in NREGA expenditure from ₹ 0 to 337.71 crore4. Thus, there is wide variation across districts in both the size of the population targeted for NREGA and the intensity of implementation of the scheme.
An alternative approach: Stratified Sampling
We propose a sampling method sensitive to the varying levels of relevance of districts to the NREGA scheme, while maintaining the random nature crucial to a representative audit5. This sampling approach incorporates sampling strategies from financial audit to more effectively capture the rich variation between districts by using a stratified random sample to select districts with likelihood proportional to their size.
The Financial Attest Audit manual of SAI India notes that "where either monetary values or assessed risks of error vary widely between transactions, alternative sampling methods [to simple random sampling] are usually preferable." If each district in India is viewed as one "transaction" or unit in the overall implementation of NREGA, there is wide variation in the "value" of each district in terms of the target population of the scheme and in terms of the intensity of implementation.The Performance Auditing Guidelines put forth by SAI India require that the sample selected be representative of the entire population, unbiased, and of sufficient size to extrapolate results to the entire population6. In addition, the auditor is given discretion to "use judgment in determining which kind of sampling is best suited to his audit job7." The methodology proposed here ensures that all three of these requirements are met, while giving CAG deeper insight into those districts where NREGA implementation has been most intensive. For more insight into creating representative samples with post-stratification weights, see Box 18
Box 1: Obtaining Nationally Representative Figures with Weights
When selecting a stratified sample, results can be extrapolated to the national level with the use of weights. In a stratified sample, observations have varying probability of selection into the sample, whereas in a simple random sample, every observation has an equal probability of inclusion. Thus, to obtain nationally representative figures, each observation within a strata must be weighted to reflect the ratio of the strata size as a proportion of the sample to the strata size as a proportion of the population. Thus, the formula for computing post-stratification weights is:

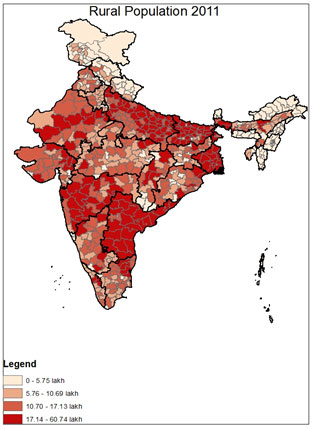
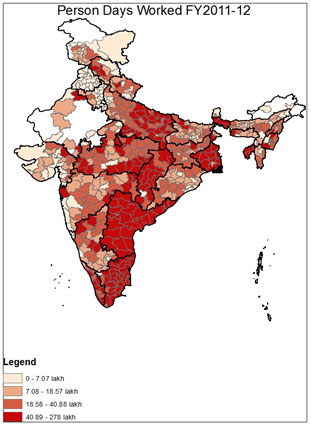
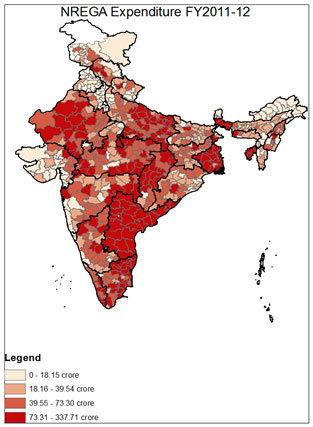
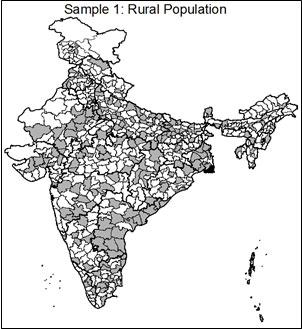
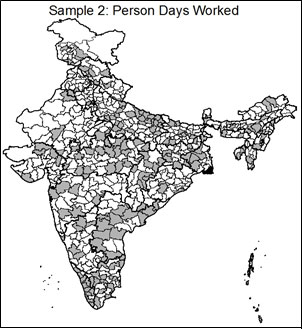
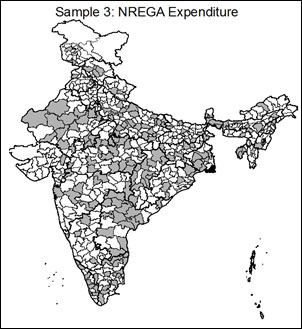
Three indicators could potentially be used for this stratified sampling: NREGA expenditure, rural population, and person days worked9. The first is a financial measure of the scope of NREGA implementation in the district, and would ensure that districts with the highest level of expenditure were accordingly most likely to be audited. In effect, as in Monetary Unit Sampling, each rupee of expenditure becomes the unit on which sampling is based, and each rupee of spending becomes equally likely to be selected for audit10. Rural population measures the potential population which qualifies for NREGA in the district, thus ensuring that the larger the targeted population in a district, the higher the probability of audit. Finally, person-days worked provides a measure of the intensity of implementation in an area. The variation in each of these three characteristics across India can be seen in the maps below.
The clear pattern seen in these three maps is that particular regions of the country are significantly more NREGA intensive by design. As can be seen in "Rural Population 2011," the areas with the highest concentration of rural inhabitants are Uttar Pradesh, Bihar, Maharashtra, West Bengal and Andhra Pradesh. Though the "NREGA Expenditure" map shows a similar pattern, several states are notably low in NREGA expenditure relative to their rural population, including Bihar and Maharashtra; by contrast, districts in Andhra Pradesh and West Bengal rank highly in expenditure, and rightfully so given the size of their rural populations. Similar patterns can be seen in "Person Days Worked FY 2011-12," which captures a combination of both implementation and rural population11. The clear pattern is that some geographical areas of the country are more NREGA intensive than others, both in the size of the scheme's target population and in the implementation of the program. In evaluating the program, then, it would be useful to look in greater detail at those districts where either the target population or implementation has been particularly intensive.
Proposed methodology
The methodology proposed is a stratified random sample, and with strata assigned based on quartiles of one of the above three variables (NREGA expenditure, total rural population, or person-days worked) and quartiles with the highest values assigned a higher probability of selection. This ensures a random sample which is representative of the entire country and in which every district has some probability of selection into the audit, but also reflects the varying levels of intensity of NREGA in different areas. This methodology is already widely used in financial audits, and is similar to Monetary Unit Sampling.12
This methodology offers significant flexibility in terms of the number of strata chosen for the variable and the weights assigned in each stratum. In this case, there are four strata reflecting the four quartiles of the variable. The probabilities used and resulting quantity of districts chosen are reflected in Table 1. This method could be adjusted to have a greater number of strata, and if desired, one or more 'key' strata could have a 100% probability of selection13. The weights used in this case were designed to result in a total sample approximately equal to that of the original performance audit, after the inclusion of districts in the second step below.
| Table 1: Sampling strata & probabilities |
| Quartile |
Prob |
# districts selected |
| Quart. 4 |
0.56 |
88 |
| Quart. 3 |
0.34 |
53 |
| Quart. 2 |
0.17 |
26 |
| Quart. 1 |
0.06 |
9 |
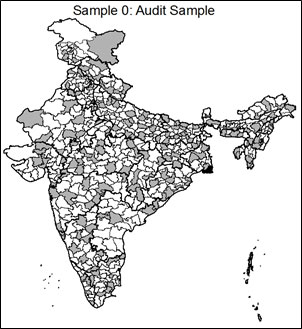
This method will naturally select a greater number of districts from higher priority units as determined by the sampling variable. In order to ensure that all states have at least one district selected, a second sampling step includes randomly selecting one district from each state or Union Territory (UT) where no districts were selected. Using each of the proposed sampling variables, this brought the total districts sampled to 184-187 districts total with at least one from each of India's 34 states and UTs. The characteristics of each of the three samples relative to the sample used in the audit and the full universe of districts can be seen in Table 2. Maps of each of the three proposed samples can be seen below.
As can be seen in Table 2, all three of the proposed sample frames capture districts which are on average higher in expenditure, rural population and person days worked than the full population and audit sample. This was achieved while maintaining the random nature and geographic spread of the original sample. The maps highlight that the targeted samples concentrate proportionally more on districts in high-intensity areas, which is desirable. For example, Andhra Pradesh has a large rural population and high level of NREGA spending, as was seen in the maps above. While only 4 of Andhra Pradesh's 22 districts were selected in the original performance audit, these three sampling methods would have resulted in between 12 and 16 of Andhra Pradesh's districts being included in the sample. This would give a much more in-depth look at the implementation levels of NREGA in these areas where the intensity of both need and implementation are highest.
| Table 2. District Characteristics |
| Hypothetical sampling frame based on… |
| Characteristics of… |
All NREGA districts |
Sample 0: Actual performance audit sample |
Sample 1: Rural population |
Sample 2: Person-days |
Sample 3: Expenditure |
| Rural Population (mean in lakh) |
1.34 |
1.40 |
1.84 |
1.47 |
1.59 |
| Total Person Days Worked (mean in lakh) |
3.22 |
3.39 |
4.48 |
5.13 |
4.95 |
| MGNREGA Expenditure (mean in crore ₹) |
54.78 |
57.91 |
74.60 |
77.05 |
82.79 |
| Number ofdistricts |
624 |
179 |
187 |
185 |
184 |
Outcomes under this sampling mechanism
For each of the three proposed samples, a variety of MIS variables were computed and compared to those outcomes for the audit sample. This gives a sense of what might have been found at the ground level, and could be used as indicative data in determining the focus of the audit. Though the MIS data has been criticized as containing some inaccuracies14, so long as these inaccuracies are broadly consistent across districts, this does not negate the usefulness of the data in determining relative levels of the indicators of interest. Moreover, the use of logical checks within the MIS data can uncover likely instances of falsification, which can be further explored on the ground15.
Recall that each of the three samples is representative of the average rural person, person-day of NREGA work, or rupee spent on NREGA, respectively. Thus, where the sample has a higher value of an indicator than the country as a whole (seen in "All NREGA Districts" in Table 3), this suggests that the indicator has higher values in higher-intensity areas. By contrast, where there is a lower value, this suggests that there may be less of a problem in higher-intensity areas.
Outcomes considered:
Table 3 shows key outcomes under each sample for variables related to: (1) expenditure, (2) works, (3) job cards, and (4) 'logical checks,' which indicate discrepancies in the MIS data. We will highlight key findings for this sampling approach generally and for each of the samples specifically.
All three samples hold one common advantage over the audit sample, which is that they perform substantially better in highlighting internal logical failures in the MIS data. These are simple flags within the MIS data indicating whether there were a greater number of households 'allotted work' than 'demanded work,' worked' than 'demanded work,' or 'worked' than 'allotted work,' each of which is logically impossible. Districts in which this occurs are those in which there is an anomaly in the data that merits further attention. The three proposed sample frames capture 3-4 fold more of these districts relative to the audit sample.16
The rural population sampling approach has the major advantage of highlighting areas where NREGA is not reaching its intended beneficiaries, an important area of review in determining the performance of the program. The percentage of rural households allotted work, demanded work, and worked are all substantially lower than in the audit sample; thus, this sampling approach would have uncovered a greater number of areas with high rural population but low NREGA coverage. In addition, the percent of rural households reaching 100 days in this sample (2.2%) is roughly half that of the audit sample (3.9%), again highlighting an important deficiency in these areas. By contrast, these four variables appear artificially high in the expenditure and person-days samples, because by design those samples are studying areas with high levels of NREGA implementation.
Whereas the rural population sample uses NREGA's intended recipients as its basis for sampling, the person-days and expenditure samples draw more intensively from areas where NREGA has been more intensively implemented. These two samples are thus largely similar in their findings.
However, the person-days sample has two key shortcomings. Due to the fact that the person-days sample emphasizes areas where labor expenses are high, it by design captures fewer districts where material expenses exceed the 40% limit. Where the rural population sample captures 42 of these districts, and the expenditure and original audit samples each capture 40, the person-days sample would have found only 34 such districts. In addition, the proportion of households reaching 100 days of work is artificially high, at 5.7%, relative to 4.3% in all districts. Thus, while person-days and expenditure generate broadly similar samples, this may be an inferior measure along the material-labor expenditure ratio and the proportion of households reaching 100 days of employment, both of which are crucial measures of NREGA implementation.
The expenditure sample shares similar characteristics to the person-days sample above, but does not suffer from the same shortcomings along the two variables highlighted. In addition, as seen in Table 2, it more effectively captures the high-spending areas where audit may be most likely to capture program failures. Thus, this sample is superior to the person-days sample.
| Table 3 |
| Expenditure |
|
All NREGA Districts |
Sample 0: Actual audit sample |
Sample 1: Rural Population |
Sample 2: Person-days |
Sample 3: Expenditure |
| % of works sanctioned that were completed |
district mean |
0.87 |
0.875 |
0.916 |
0.853 |
0.877 |
| Material expenses exceed 40% |
total in sample |
150 |
40 |
42 |
34 |
40 |
| Works |
| % demanded who were allotted work |
district mean |
0.995 |
0.994 |
0.985 |
0.999 |
0.999 |
| Proportion of person-days by women |
district mean |
0.392 |
0.4 |
0.39 |
0.436 |
0.431 |
| % rural households allotted work |
district mean |
0.354 |
0.351 |
0.296 |
0.44 |
0.42 |
| % rural households demanded work |
district mean |
0.356 |
0.352 |
0.296 |
0.44 |
0.421 |
| % rural households worked |
district mean |
0.338 |
0.336 |
0.289 |
0.456 |
0.399 |
| % rural households reaching 100 days |
district mean |
0.043 |
0.039 |
0.022 |
0.057 |
0.044 |
| Job cards |
| % job cards applied that were not issued |
district mean |
0.012 |
0.015 |
0.013 |
0.014 |
0.011 |
| Logical Checks |
| Greater # households allotted work than demanded |
total in sample |
42 |
12 |
14 |
18 |
12 |
| Greater # households worked than demanded work |
total in sample |
22 |
4 |
16 |
12 |
14 |
| Greater # households worked than allotted work |
total in sample |
23 |
5 |
16 |
13 |
15 |
Potential extensions of this methodology
- 1. Sampling at 100% in key areas
For certain strata of a variable it may be advantageous to sample at 100% probability. For example, if expenditure was broken into strata based on decile, it may be useful to sample with 100% probability from the highest decile of expenditure. This would be akin to selecting 'key' or 'high-risk' observations, as is done in Monetary Unit Sampling17. This methodology is useful when auditors "identify a relatively small group of transactions which are sufficiently important that an error in any one of them would have serious implications for the account area18." The lowest decile of spending could also be interesting insofar as it may indicate that NREGA implementation is for some reason stalled in that area. This same reasoning could be applied to high rural population areas.
Short of sampling some areas at 100%, the probabilities chosen per strata can be adjusted dependent upon the desired composition of the sample, while still maintaining the random nature of the sample and the ability to achieve representative estimates using post-stratification weights.
- 2. Sampling on multiple variables
While three potential sampling variables have been presented here, numerous other possibilities exist. One variation would be to sample along two or more variables; for example, both rural population and NREGA expenditure could be used in the sampling process. This could involve sampling proportional to population and then adding districts above a certain spending threshold, or drawing two samples (without replacement) first along population and then along expenditure. Either of these methods would capture the strengths of both sampling strategies without being significantly more intensive to implement.
- 3. Using 'flags' to sample key districts
In Table 3, a number of logical checks are performed on the NREGA MIS data to identify internal contradictions. Other flags were also created, such as for districts where the material expenses exceed more than 40% of total works expenses overall in the district. These types of comparisons within the MIS data could be used to identify a sample of 'key' districts which are sampled at 100%, similar to the practice used in Monetary Unit Sampling for high-risk transactions.
- 4. Purposeful sampling at the Pradhan village
While it is crucial to maintain a random sample to attain a representative view of what is happening at the country level in the NREGA scheme, within each GP Pradhan villages could be selected purposefully in order to examine implementation at the village level. This would be omitted for any representative analysis, but could be used to examine hypotheses, such as the possibility that works are concentrated near the Pradhan residence. Strong evidence has been shown to support this hypothesis, which could be corroborated on a wider basis19.
In conclusion
Methods from financial auditing, paired with available data, can enhance the effectiveness and efficiency of the performance auditing process. This report proposes a stratified sampling approach based on rural population or NREGA expenditure for the NREGA performance audit. This approach would have increased the effectiveness of the audit by examining a higher proportion of high-impact areas; this would give a clearer picture of the implementation of NREGA in these areas while still fulfilling the requirements of representativeness and randomization. Ultimately, this approach could have identified a greater proportion of key failures on the ground in the audit report, exposing these to the Indian people, and at the same time would have acted as an increased deterrent against future implementation failures in high importance areas of NREGA.
|